Incubator

The world needs someone looking around the corner to recognize tomorrow’s solutions—today.
The Incubator is where the U.S. Chamber Foundation pilots bold ideas to tackle pressing challenges. We identify emerging issues, test innovative approaches, and help businesses and communities prepare for the future.
Innovation: Our Greatest Asset
Through our Innovation Model, we move ideas from concept to impact:
- Spot emerging challenges before they become crises
- Pilot bold solutions with partners across business, government, and communities
- Scale what works to create lasting change
Our focus areas are constantly changing, and we welcome ideas from partners. Sample topics include:
- Artificial Intelligence
- Nanotech
- Quantum Computing
- Pandemic Preparedness
- Bioterrorism and Biosecurity
- Misinformation
Spotlight

U.S. businesses operate in a world of evolving international policies and heightened geopolitical tension. Our analysis of corporate financial reports and earnings calls reveals accelerated concern.
This report provides a data-based assessment of how U.S. companies perceive geopolitical risk and articulates a recommended decision-making process and framework to manage such risk.
Programs

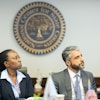
We foster dialogue and forge powerful public-private partnerships to address geopolitical threats. Our approach is a new way to mobilize whole-of-society solutions to whole-of-society problems.

Launched in 2023, our two-year, full-time program offers a unique early career experience through an intellectually stimulating environment at the intersection of business and government.

Our latest pilot is an AI-powered platform that provides business leaders with a curated repository of real-world, proven solutions to complex challenges, starting with childcare.
Insights
- Emerging Issues
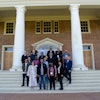
Justice Across Borders: How the Judicial Fellowship Program Is Building a Global Network of Rule-of-Law ChampionsThe Judicial Fellowship Program united 25 judges from 18 countries to share strategies for judicial independence, transparency, and rule of law. Organized by the U.S. Chamber of Commerce Foundation and the Presidential Precinct, the Fellowship is building a lasting alumni network to strengthen courts, democracy, and public trust worldwide.
By Melissa Mendizabal

- Emerging Issues
Integrating Hindsight, Insight, and Foresight
By Kelsey Margey - Emerging Issues
Winning the Race for Quantum Supremacy
By Kelsey Margey


- Emerging Issues
AI Judging AI: Top 4 AI Chatbots Evaluate Themselves
By Melissa Mendizabal


Legacy Programs

The Civic Trust® is a nonpartisan educational initiative dedicated to enhancing civic literacy, skills, and participation across schools, workplaces, and communities. Through programs like the National Civics Bee®, we partner with state and local chambers, businesses, policymakers, and community leaders to offer dynamic opportunities.
Launched in 2024, our two-week program offers an immersive professional exchange and residential learning opportunity for foreign judges and magistrates who are passionate about strengthening legal systems.
Latest Content
- Many employers say the technology is helping workers save time, improve quality, and take on more ambitious assignmentsSmall businesses are navigating two forces at once: rapid technological change and an unpredictable threat landscape. The ones who are building for both aren't just surviving—they're the engine driving their communities forward.“Rule of law” can sound like a phrase reserved for law school classrooms or bar exam prep, not something that affects everyday life. But Law Day, May 1, is a celebration for every American; because rule of law isn't a legal abstraction—it is the foundation of a thriving society.In our annual impact report, see how we're harnessing the power of business to move from vision to real impact in communities across America and around the world.Introducing “On the Horizon,” a new series from our Innovation Scholars exploring the signals and trends shaping the future of business and society.The Judicial Fellowship Program united 25 judges from 18 countries to share strategies for judicial independence, transparency, and rule of law. Organized by the U.S. Chamber of Commerce Foundation and the Presidential Precinct, the Fellowship is building a lasting alumni network to strengthen courts, democracy, and public trust worldwide.Our Global Threats Initiative aims to mobilize whole-of-society solutions to whole-of-society problems. Senior Manager Kelsey Margey and Innovation Scholar Charlie Edwards share more insights and connect the dots from our latest research.This fall, our Judicial Fellowship Program will bring together 25 judges and magistrates from 18 countries across 6 regions of the world to Washington, D.C., and Virginia for a rigorous two-week program focused on upholding the rule of law.U.S. businesses operate in a world of evolving international policies and heightened geopolitical tension. Our analysis of corporate financial reports and earnings calls reveals accelerated concern.