Workforce

Talent is one of our country’s most important assets—yet our current methods for discovering and cultivating talent are outdated—built for another time and a different economy. For America to grow and prosper, we need new systems fit for our modern economy.

Our shared economic success as a nation will depend on our ability to source, develop, and deploy our workforce successfully, but for too many the labor market is broken, inaccessible, or non-existent.— Jason Tyszko, U.S. Chamber Foundation Senior Vice President
Scaling Up Skills-Based Employment Practices for American Businesses
Business Roundtable, SHRM, and the U.S. Chamber of Commerce are joining together to scale up skills-based employment practices for American businesses.

The U.S. Chamber of Commerce Foundation and IBM Exploring How Innovation is Shaping the Future of Work
A human-centric, principled approach to help assess the risks of large language models
Read More

Programs
The challenge of our time is creating a workforce system that develops the talent needed for the jobs of today and tomorrow. At the U.S. Chamber Foundation, we address this challenge through our commitment to promoting innovative workforce development solutions. We achieve this by building employer-led, agile workforce development systems and programs.


Latest Content
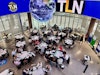
Annual meeting brings together various industries to chart the path for the initative.
Cohort participants in four states will pilot the LiLAs, a universal, portable skilling investment tool, in their respective communities, empowering learners nationwide.
Elise Awwad, President and CEO of DeVry University, is a lifelong learner and passionate leader, championing education as a tool for challenging societal norms and achieving economic mobility, especially for women.
More than 70 million adults in the United States are skilled through community college, workforce training, bootcamps, certificate programs, military service or on-the-job learning, rather than through a bachelor’s degree. Learning and employment records (LERs) could play a critical role in advancing skills-based hiring practices and ensuring they are implemented equitably.
Skills-based hiring and advancement is the practice of evaluating a candidate beyond education credentials and experience requirements to assess a candidate’s unique skills, abilities and demonstrated competencies. At the 2023 Talent Forward, we asked ten industry leaders about how they are embracing skills-based hiring practices, and how employers can join the movement to build a more robust talent pipeline.
U.S. Chamber Foundation’s Hiring Our Heroes Spotlights Companies and Individuals with a ‘Commitment to Service’ at 13th Annual Awards Gala
In recent years, there has been a prominent shift in the way we think about the workplace. As the home and office become one, there is greater visibility into the lives of employees, and how they show up to work as their true, authentic selves.
As the world pivots towards a future that demands adaptability and diverse skill sets, the U.S. Chamber Foundation’s annual Talent Forward summit emerges as a cornerstone event that embodies the pursuit of a more prepared, agile, and prosperous workforce.
The U.S. Chamber of Commerce Foundation has recently named 13 new Talent Pipeline Management® (TPM) Fellows.